
A challenge I had with running a startup was managing all of the tiny services that were needed to run it. One particular service I didn’t understand why it cost so much was form submission software.
Isn’t it just a POST request and dropping the data somewhere? In fact, the storage capacity needed to store 10,000 email addresses is less than a megabyte.
So I started to think of alternative solutions for form submissions. That’s $10/mo I could be saving. I needed:
- a POST endpoint,
- a place to store data and
- some way to analyze that information.
Fortunately, I found a workflow that could string this together for me: AWS Lambda + CloudWatch.
AWS CloudWatch
CloudWatch is typically used to log and monitor information for different backend services. Any kind of service logging typically shows up in CloudWatch.
CloudWatch also ships with a neat ability to make dashboards. This means that you can organize and view log information as graphs.
Set-Up
The only thing you need to stand up for form submissions is setting up a serverless API.
By default, any console.log statements from a Lambda function will log their output to AWS CloudWatch.
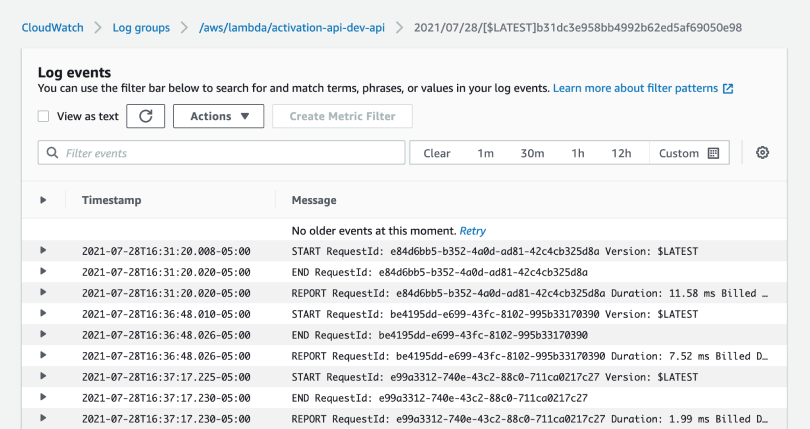
To add form submissions to your product, you’ll create a route called /submit in your API. You can then log the body into your CloudWatch logs.
This works with a typical client-side HTML <form> tag.
router.post('/submit', (ctx) => {
    // request body as JSON
    const body = ctx.req.body;
    // log the body
    console.log(JSON.stringify(body))
})
One challenge with a simple logging endpoint like this is spam data. So I’d also recommend you add some kind of email validation before logging noisy information.
Getting Form Submissions
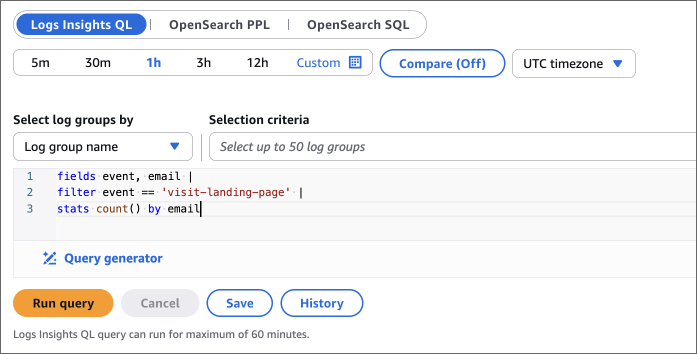
As long as you print a JSON object, Log Insights will parse the fields. By default, CloudWatch makes everything queryable with SQL. All you need to do is print a JSON object.
So for example, if your print output looked like this:
{ "event": "visit-landing-page", "email": "hi@ravi.com" }
We can write a query in log insights to get all the visit-landing-page events. You could take it a step further and group all the events by email as well.
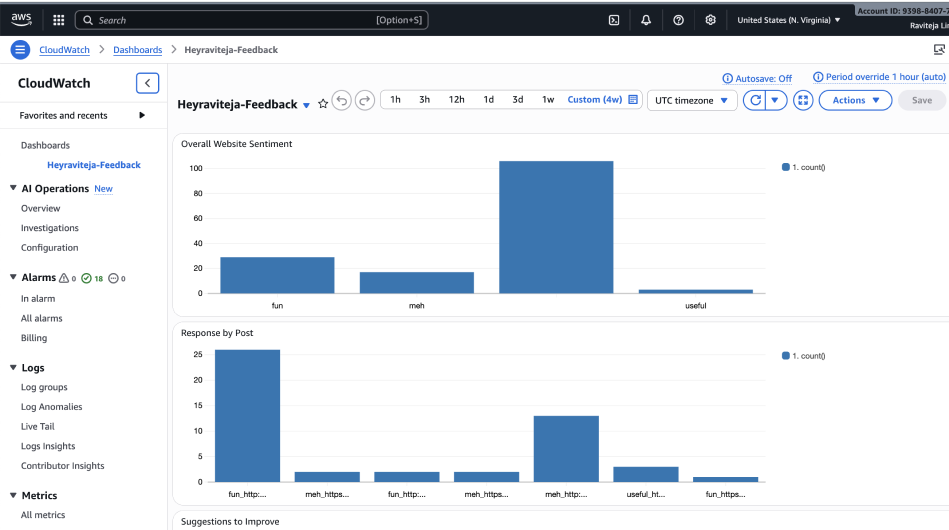
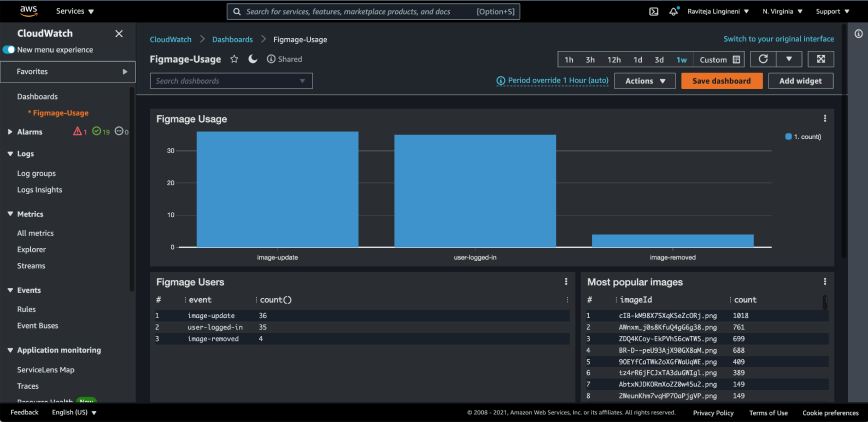
The fun thing is that CloudWatch insights can be used to log anything. Not just form submissions. I pin most of my queries for various events to a dashboard. The dashboard updates with live bar graphs, line graphs and flat tables with various product information.
CloudWatch dashboards can also be shared with non-engineers and they can be granted access via email or SSO. I found this helpful to share the dashboard with people working on my startup.
For most of my solo and indie projects, I was happy that CloudWatch fit my needs. I didn’t need to jump to yet another service.